To facilitate the discussion of “doing public geography and making scholarship public” at the IGJ, Victoria Habermehl, Guillermo Delgado and Nik Theodore designed a matrix in order to organize and compare the contributions of the participants of the session. The matrix was intended to find a set of components that could be identified within the different contributions that would allow the projects to be compared. It is important to note that the matrix was designed on site, and therefore has all the shortcomings (and virtues) of a spontaneous attempt to find a common ground.
The matrix was organized on a x-y plane, in which the x-axis would indicate the phase of the project and the y-axis the public involvement. Initially, the space where the “public moment” took place was identified as a key element of the process, but since it was not possible for all the projects to indicate this, it was ultimately not incorporated. The different examples of publics included in the y-axis were: academia–namely researchers, students, teachers, thinkers; policy makers–namely the state; the private sector; the “general public” (a tentative and much debated category that included not just the media but “everyone”); the community in which the project is focused on and working with; mass-based organizations (including churches); and non-human parties (e.g. fauna, flora).

Figure 4: The matrix
The team was aware that representing the development of research projects as linear on the x-axis–as a sequence of preparation, research, and then dissemination–was problematic. Part of the discussion during the session focused on the limits of the matrix, which forced people to question how they saw the public. In particular the fixed linear development of the research projects on the x-axis raised the question of the temporalities in which these components of public scholar engagement unfold. Ultimately, some of the comments revolved around whether (1) preparation, (2) research, and (3) dissemination happened in (A) a subsequent way, (B) with some overlaps in their development, (C) in an iterative way, (D) simultaneously, or (E) in a cyclical way. For representation purposes, the possible components of the research project were represented in a subsequent way.
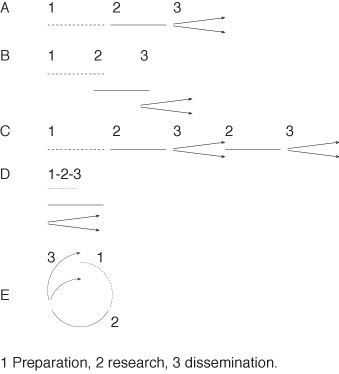
Figure 5: The development of different research projects
This form of representation could also be used as a visual presentation of different attributes of public engagement. While emphasizing once again that the matrix is not normative, using this visualization enables the comprehension of the variety of public engagements that were presented during the sessions. For instance, if the community was involved in the three stages of development of a project, it could be said to be “community-led”; if the people involved throughout were within academia, the project could be said to be “academic-led”. Other variants that could also be visualized through this exercise were the involvement of multiple parties: while in some cases only two parties were involved, others appeared to include a wide range of parties.

Figure 6: The variety of public engagements
Rather than aiming at producing a “catalogue” of public engagement, the idea here was to start grasping the different characteristics of the range of public engagements that were presented. Therefore, it is worth saying that rather than trying to only categorize the projects in a simplistic way, it was clear to the participants and the team that the actual character as well as virtues and shortcomings of each contribution could have only been fully conveyed in combination with the narrative and personal experiences of participants, which included perceptions, post-rationalizations, and sentiments about the lived experience of these public processes. As such, the diagrams provided a useful tool to think through and compare what we meant by “public”, forcing us to engage more deeply with this issue. More information on each of the projects follows, and the matrix is available here if you would like to analyse your own project.
(A) Urban Union
(C) Informal Economy Monitoring Study
(D) Washington Inter-City Self-Help
(E) La Región de Los Lagos post-crisis del virus ISA
(F) Ending mandatory detention campaign
(H) Home Economics